
Progression Visualization: Co-design of analytics tools using shared data
by Laure Haak
Wonderful things can come from collaboration. Zhaoqing (Jimmy) Chen, a graduate student at UC Santa Cruz in Magy Saif el Nasr’s lab, working with Luke Swanson, a graduate student in Field Day Lab at the University of Wisconsin, used open game data to develop an entirely new tool for analyzing gameplay pathways.
But let’s take a step back and dig into the question they were asking. Jimmy is studying how to visualize the process of playing a learning game. “Specifically, we are using a node edge graph in which directed edges reflect kernel logical order,” he explained. This visualization methodology provides a way to follow how a user plays a game, choices they make, strategies for solving problems – and explore how context may affect these pathways.
On the data team at Field Day Lab, Luke has been helping to build tools and infrastructure for instrumenting games and sharing game data. “We've got a lot of game data that we want to share to support other researchers in the community who are interested in analyzing gameplay,” he said. “Jimmy's visualization tools are a really great example of that.”
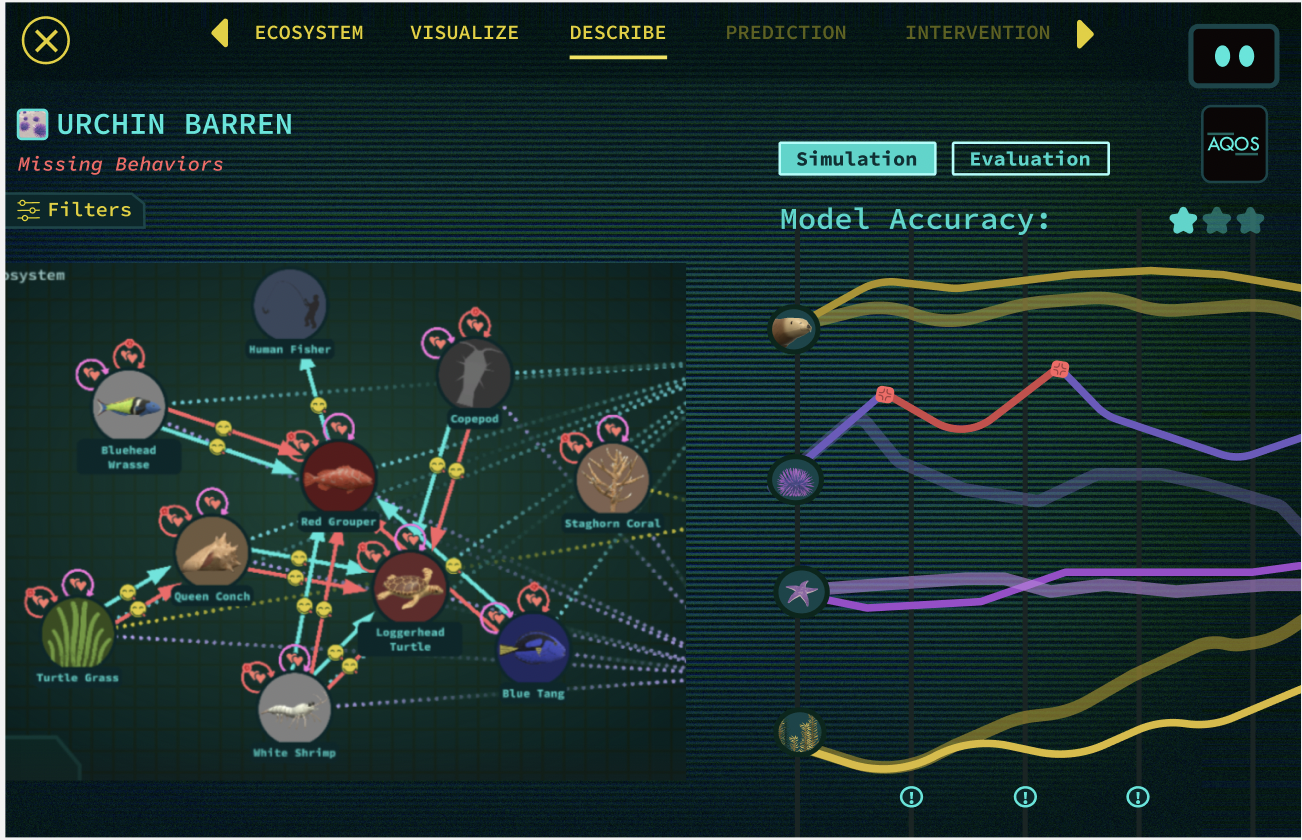
Jimmy has been using shared data from Wake, Tales from the Aqua Lab, a game designed by Field Day. Game code and anonymous player data are available through the Field Day Vault, a distribution platform for learning games (see our Extending the Life of a Game blog). The game was instrumented to log events, such as when a player clicked what button. Event data from the game is a series of ordered events for each player who plays the game.

The specific question both Luke and Jimmy were interested in was understanding how players progress through a game. Wake has a non-linear structure that allows players to take on different jobs in a Marine ecology context, a perfect fit for developing a pathways visualization tool.
“Because of the many, many, many different ways that players could choose to do those jobs in different orders, it gets tricky to understand the paths that players take through this game,” said Luke. This kind of analysis is a step-departure from standard event logging to improve game design (see our Data for Game Design blog), which might involve visualization of how players move through the game, what parts of the game they interact with. Another common analysis theme is research to understand learning in games, which usually involves pre- and post-testing with participants. Visualization in this context might be work to look at correlations between players or contexts. “The most common visualization used in learning research is a dashboard,” said Jimmy. “A single static visualization to show the performance of students.”
But instead of tables and charts, Jimmy wanted to be able to interact with and explore gameplay data. Process visualization enables researchers to do just that. “You can go deep into the action, and select a specific action and understand, for example, how a player reached this action,” he said. “The problem for process visualization is cluttered visualization. It's really hard to understand what a player did along the path.”
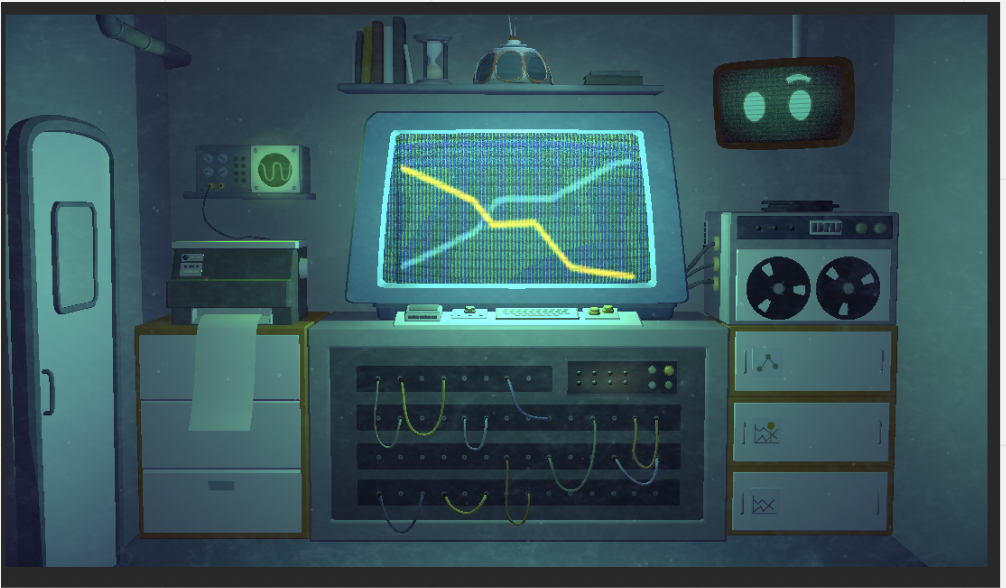
image from Wake: Tales from the Aqualab
So, working together with Luke and using the shared Wake gameplay data, Jimmy was able to iterate through versions of the tool, refine the analysis and user interface. Researchers can select nodes, paths, players, and focus on what actions in the game lead to completion. Particularly for games in which players have a lot of latitude for moving through the game, progression visualization provides a way to determine the pathways that most effectively get a player to finish the game's core narrative. Does gameplay meet designer expectations?
“I think a novelty here is to embed the features or interactivities into the visualization, to make it more readable, explainable, and interpretable,” said Jimmy. “ Previously, if you want to change the visualization, you would need data scientist skills,working with the data backend, without any feedback. Now, with the progression visualization tool, you can analyze the data interactively.”
To use the tool effectively, the analyst needs to have knowledge of the context of the data itself. That is where partnering with the game design team is critical, as is game metadata models and shared standards for event logging. Field Day is currently working with other research teams to develop a shared standard for event data.
Further Reading
Teng, Z., Holmes, J., Dominguez, F., Pfau, J., Junior, M.E., El-Nasr, M.S. (2025). Identifying Player Strategies Through Segmentation: An Interactive Process Visualization Approach. In: Plass, J.L., Ochoa, X. (eds) Serious Games. JCSG 2024. Lecture Notes in Computer Science, vol 15259. Springer, Cham. https://doi.org/10.1007/978-3-031-74138-8_7
This article is part of a series on pilot projects carried out by the Field Day team in collaboration with internal and external partners, to explore the opportunities and benefits of creating shared approaches to learning games, through standards, processes, and infrastructure. This work was supported by the National Science Foundation, Grant # 2243668